Fetching data, please be patient.

HOW TO USE

How to use the GeoPolRisk tool?

Home / How to Use

How to Use

How to Use ----

The GeoPolRisk Method

The GeoPolRisk method is a product-level supply risk assessment method assesing the 'outside-in' impacts of resource supply disruption on a product system. It was developed to calculate the supply risk of a resource from the point of view of a country, region, or group of countries and serves to complement environmental indicators in LCA.

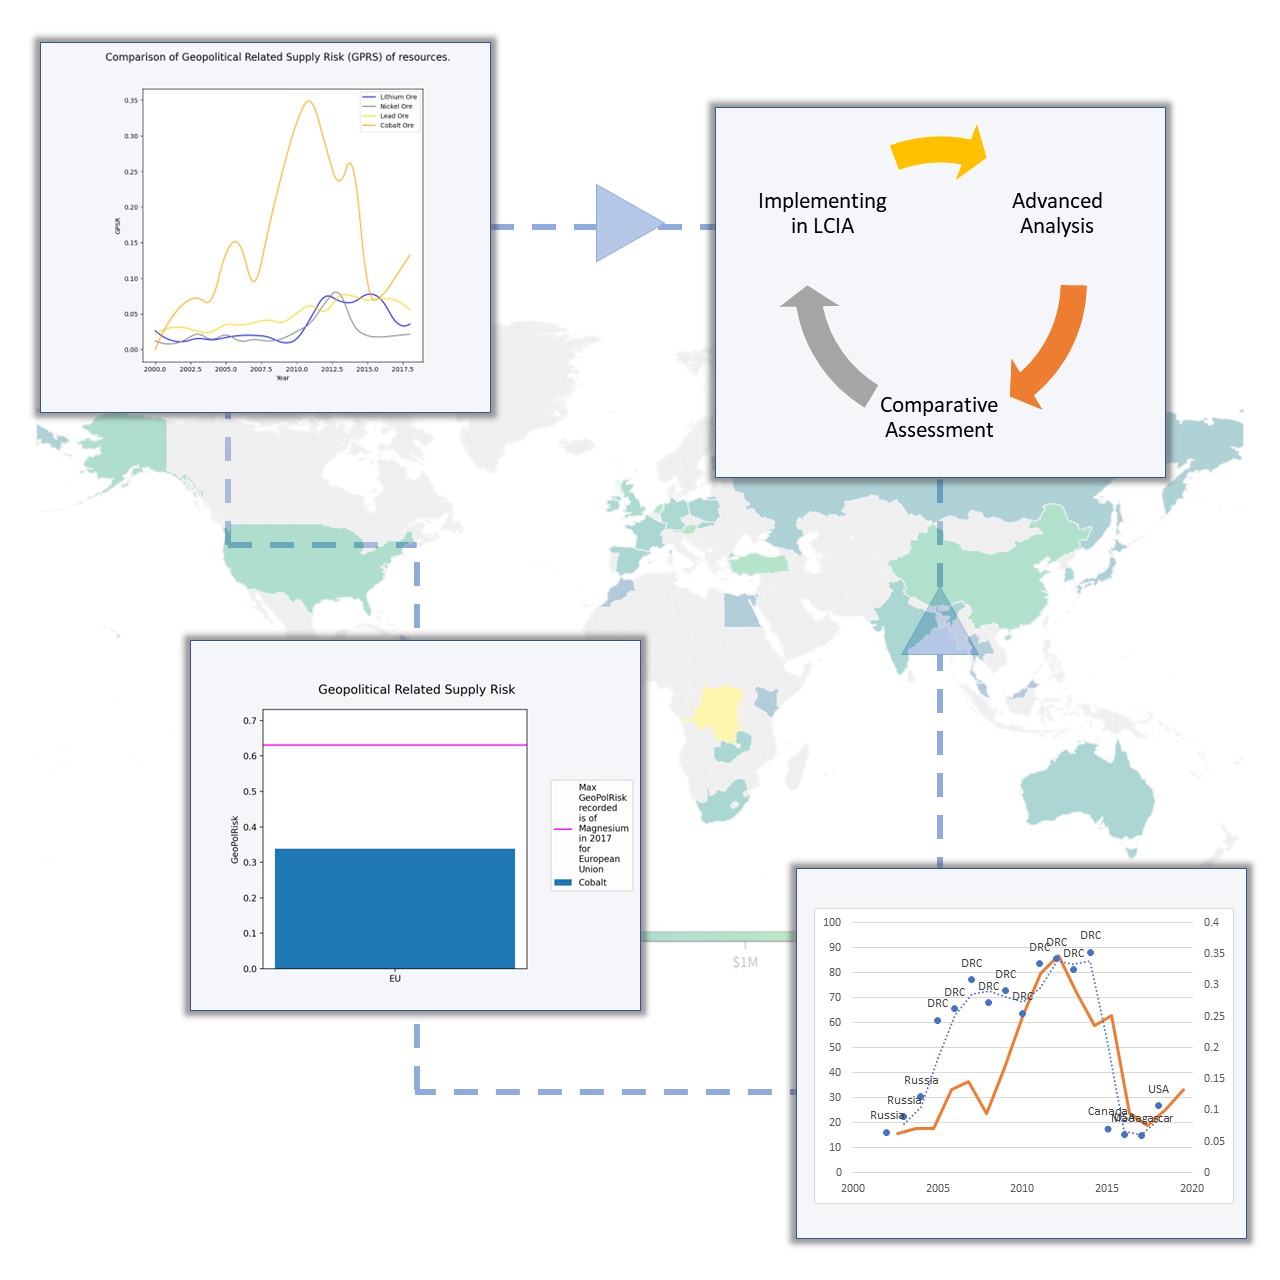
The GeoPolRisk method provides a value for the geopolitical related supply risk (GPRS) and a characterization factor for the midpoint indicator 'Supply Risk Potential' (CF)

#
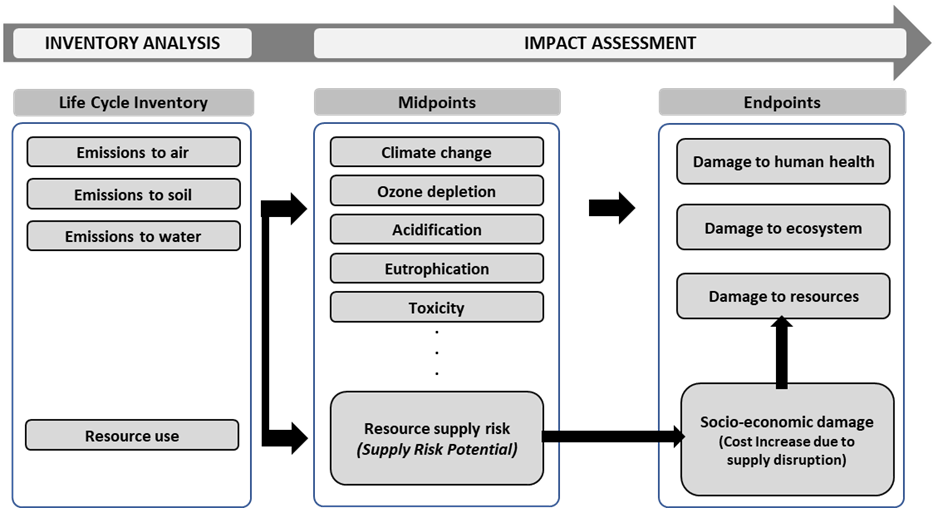
Life Cycle Impact Assessment (LCIA) framework for integrated assessment of GeoPolrisk Method.

With the recent publication on the improved resource midpoint indicator1, the midpoint characterization factor for the supply risk potential indicator has three components; the Herfindahl-Hirchmann index, the Weighted Average of Import Shares (WTA), the yearly average price of the resouce (P)

Our extensive list of characterization factors (CFs) for 31 resources makes the GeoPolRisk method one of the most sought out indicator for the natural resources area of protection. The indicator represents amount of resources under imminent risk of supply disruption measured in monetary units.

Concentration of production of a resource in a country may also contribute to the supply risk of that particular resource. The normalized Herfindahl-Hirschman index (HHI) of a resouce, a component of the GeoPolRisk method, represents the production concentration of a resource ranging from 0 to 1 where 1 indicates the production of a resource is concentrated in one country.The

GPRS is the product of the HHI and the WTA, and the resulting value can be used as for comparing the risk associated with importing the resource in the perspective of different countries or same country importing a different resource

Using the GeoPolRisk tool as a researcher.

Historical data benefits researchers to observe the trends and analyse certain hotspots to study the effects and consequences. Our current database is populated with 31 resources including metals, non metals and fossil fuels. The background data required to evaluate the supply risk are available from 2000 to 2020.

Click on the download link from the menu bar to log in and download the latest CFs to apply it to your life cycle inventory.


#
#

Using the GeoPolRisk tool and the geopolrisk-py library for a company.

Use the GeoPolRisk tool to get the country level characterization factors for the supply risk potential indicator or use the GPRS value for a comparative risk assessment.

The geopolrisk-py library has the ability to import company specific trade data to calculate the company specific GPRS and characterization factors.

The plots module in the library can be used to visulize the calculated results that can be used in presentations and reports.


Using the GeoPolRisk method to rethink trade policies.

The components of the GeoPolRisk method corresponds to different aspects of the supply risk of importing a resource.

Using the results from a calculation and analysing the components pin points to the specific hotspots needed to consider in policy making. A high value in the HHI indicates that the production of a resource is concentrated in few countries. This scenario is compounded if the countries that produce the resource have a poor geopolitical score.

Countries that have an option to domestically produce the resource invest in minerals exploration and support offtake agreements. Those who rely on supply of the resource identify other potential sources or innovate technologies to recycle it.

Policy makers can use this method and tool to analyse certain hotspots in the supply chain and adapt policies accordingly.


#
How to use the tool?

How to use the tool?

01

Resources, Countries and Period

The resources listed corresponds to the commodity in which they are traded (Refer to the geopolrisk-py library documentation for a full list of resources and its corresponding commodity codes). Select one or more resources, countries and year up to 15 of each.

02

Recycling Scenarios

Domestic recycling rate of the resource shall be provided as an input here. This factor reduces the imports and also redistributes the import share. Since the calculation reduces the import a particular country whose political stability could vary, the tool presents values based on a best case and a worst case scenario

03

Visualize Production Concentration

Visualize the producers of selected resource for a year on a geo map. The color ranges from yellow to red indicated a low producing country to a high producing country. The map is scalable and each share of resource production can be seen at the mouse tooltip.

04

Characterization factors

Download the latest characterization factors from the download page. Unregistered users can create a login and download the characterization factors.